ADDRESS
Khurrampur, Farrukh Nagar, Haily Mandi Road, Gurgaon, Delhi (NCR)
Statistics Mathematics
Statistics is the study of the collection, analysis, interpretation, presentation, and organization of data. In other words, it is a mathematical discipline to collect, summarize data. Also, we can say that statistics is a branch of applied mathematics. However, there are two important and basic ideas involved in statistics; they are uncertainty and variation. The uncertainty and variation in different fields can be determined only through statistical analysis. These uncertainties are basically determined by the portability that plays an important role in statistics.
Statistics are used in virtually all scientific disciplines, such as the physical and social sciences as well as in business, the humanities, government, and manufacturing. Statistics is fundamentally a branch of applied mathematics that developed from the application of mathematical tools, including calculus and linear algebra to probability theory.
In practice, statistics is the idea that we can learn about the properties of large sets of objects or events (a population) by studying the characteristics of a smaller number of similar objects or events . Gathering comprehensive data about an entire population is too costly, difficult, or impossible in many cases so statistics start with a sample that can be conveniently or affordably observed.
Statistics and mathematics are two intertwined fields that rely heavily on each other. Statistics is a branch of mathematics that deals with the collection, organization, analysis, and interpretation of data. It provides a set of tools and methods to understand the world around us through quantitative data.
Here's a more detailed explanation of how these two fields connect:
Foundational Role of Math in Statistics: Statistical methods are heavily rooted in mathematical concepts from probability theory, calculus, linear algebra, and more. Probability theory helps us understand the likelihood of events occurring, which is crucial for statistical analysis. Calculus provides tools to analyze and model complex relationships within data. Linear algebra helps us find patterns and trends in large datasets.
Statistical Data Analysis Techniques: Many statistical techniques are mathematical formulas that have been developed to summarize, analyze, and draw inferences from data. For instance, the mean, median, and mode are all statistical measures of central tendency, and each is calculated using a specific mathematical formula.
The two major areas of statistics are known as descriptive statistics, which describes the properties of sample and population data, and inferential statistics, which uses those properties to test hypotheses and draw conclusions. Descriptive statistics include mean (average), variance, skewness, and kurtosis. Inferential statistics include linear regression analysis, analysis of variance (ANOVA), logit/Probit models, and null hypothesis testing.
Descriptive statistics mostly focus on the central tendency, variability, and distribution of sample data. Central tendency means the estimate of the characteristics, a typical element of a sample or population. It includes descriptive statistics such as mean, median, and mode.
Variability refers to a set of statistics that show how much difference there is among the elements of a sample or population along the characteristics measured. It includes metrics such as range, variance, and standard deviation.
The distribution refers to the overall "shape" of the data, which can be depicted on a chart such as a histogram or a dot plot, and includes properties such as the probability distribution function, skewness, and kurtosis. Descriptive statistics can also describe differences between observed characteristics of the elements of a data set. They can help us understand the collective properties of the elements of a data sample and form the basis for testing hypotheses and making predictions using inferential statistics.
Inferential statistics are tools that statisticians use to draw conclusions about the characteristics of a population, drawn from the characteristics of a sample, and to determine how certain they can be of the reliability of those conclusions. Based on the sample size and distribution, statisticians can calculate the probability that statistics, which measure the central tendency, variability, distribution, and relationships between characteristics within a data sample, provide an accurate picture of the corresponding parameters of the whole population from which the sample is drawn.
Inferential statistics are used to make generalizations about large groups, such as estimating average demand for a product by surveying a sample of consumers' buying habits or attempting to predict future events. This might mean projecting the future return of a security or asset class based on returns in a sample period.
Date : 07 Oct, 2023
Statistics Mathematics

WEB DESIGNING
10 Nov, 2019
view gallery
PHP

AUTOCAD 2020

DIGITAL MARKETING
OFFICE 365
10 Nov, 2019
view gallery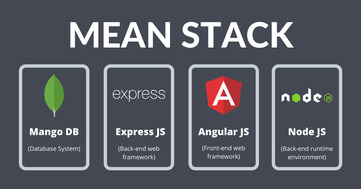
MEAN STACK
10 Nov, 2019
view gallery
SOLID WORKS 2016
10 Nov, 2019![]()

REVIT STRUCTURE

JAVA TRAINNG
10 Nov, 2019
view gallery
HTML TRAINING

WEB DEVELOPMENT

EMBEDDED SYSTEM
10 Nov, 2019
view gallery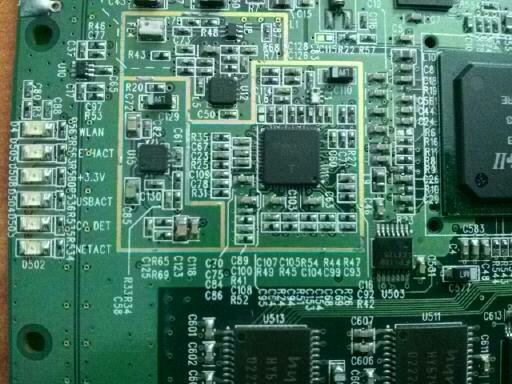
Embedded Hardware

C Language
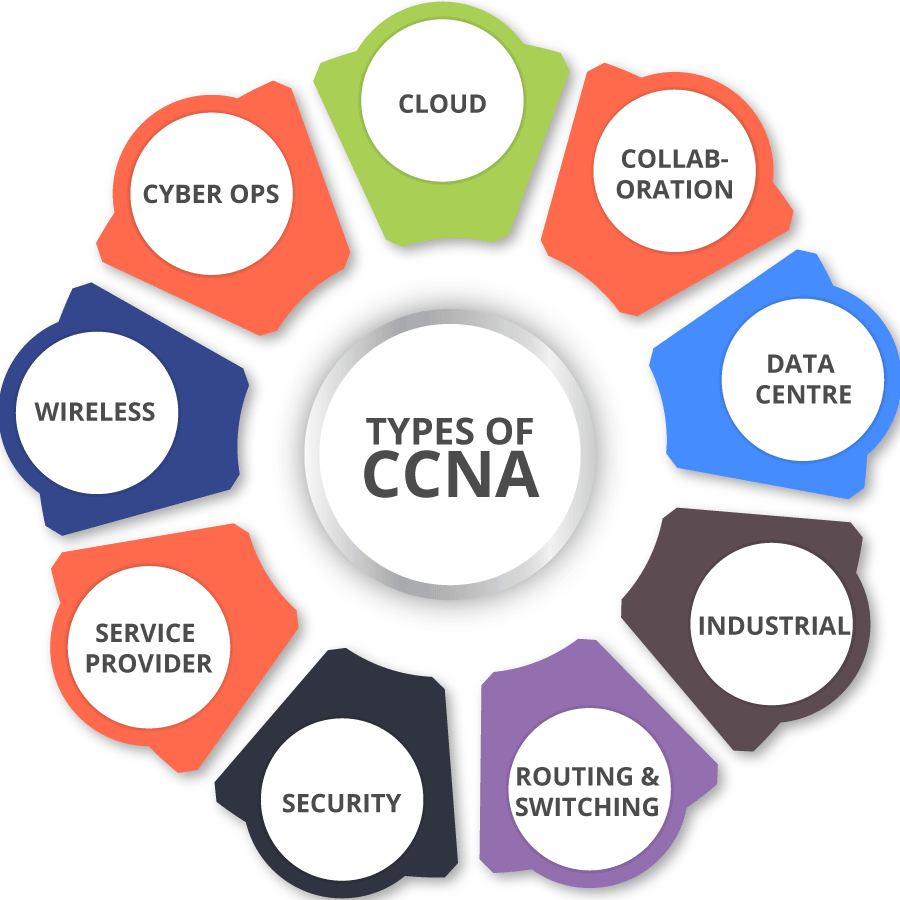
CCNA

Tax Auditor
10 Nov, 2019
view gallery
Entrepreneurship Development Program
Finance Manager
Database Administrator

System Administrator
10 Nov, 2019
view gallery
Information System Manager

Computer Science Technology

Computer and Information Research Scientist
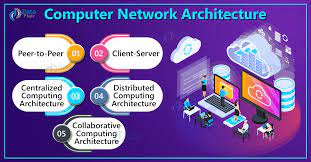
Computer Network Architects
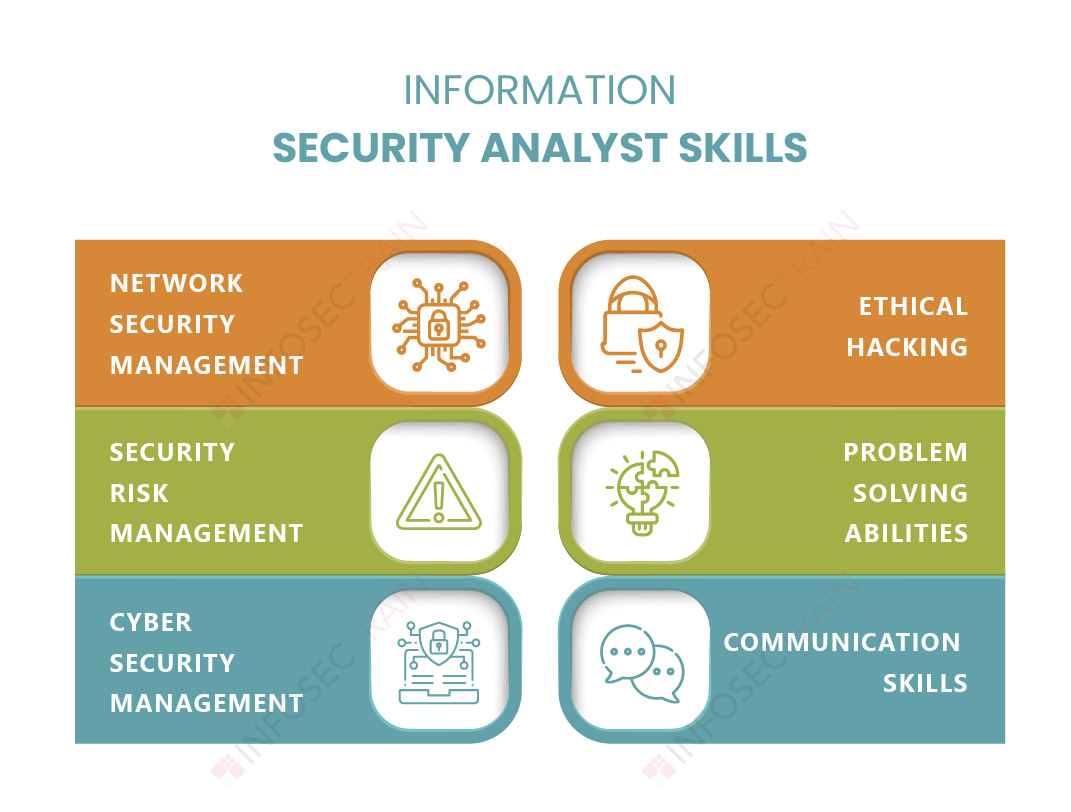
Information Security Analyst
10 Nov, 2019
view gallery
Database Administrators and Architects
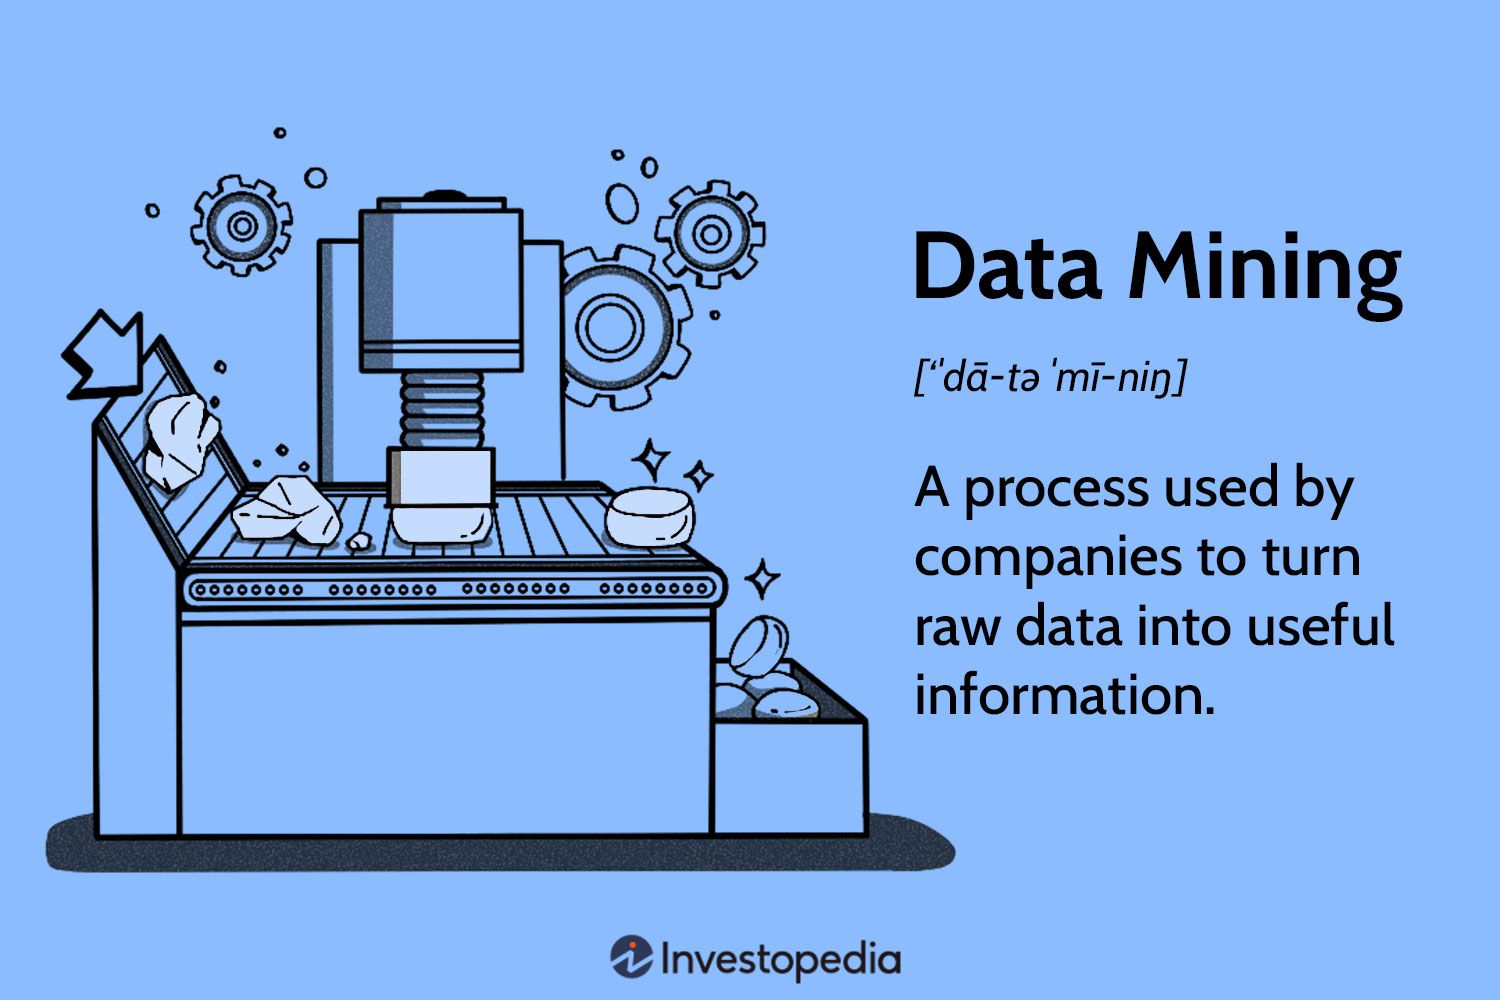
Data Mining
Deep Learning

Computer Vision
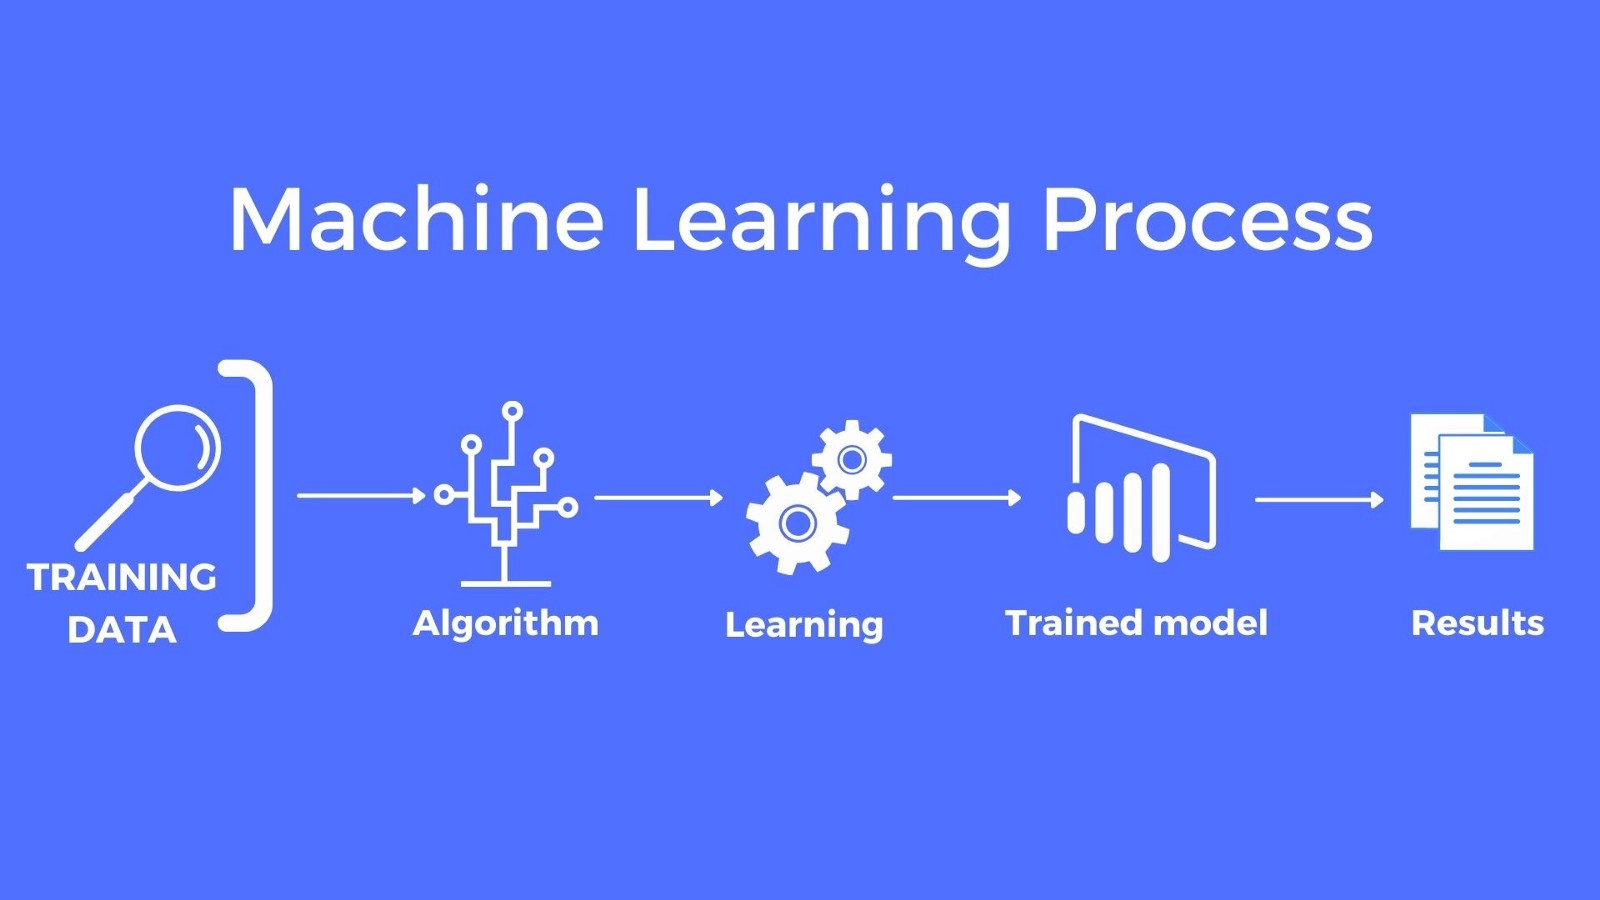
Machine Learning
Big Data Analytics
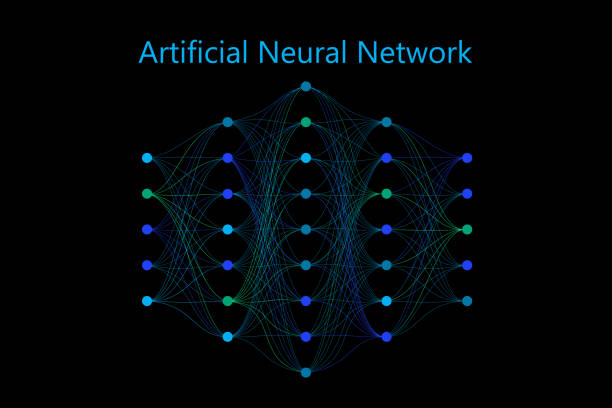
Neural Networks

Wealth Management and Financial Planning
10 Nov, 2019
view gallery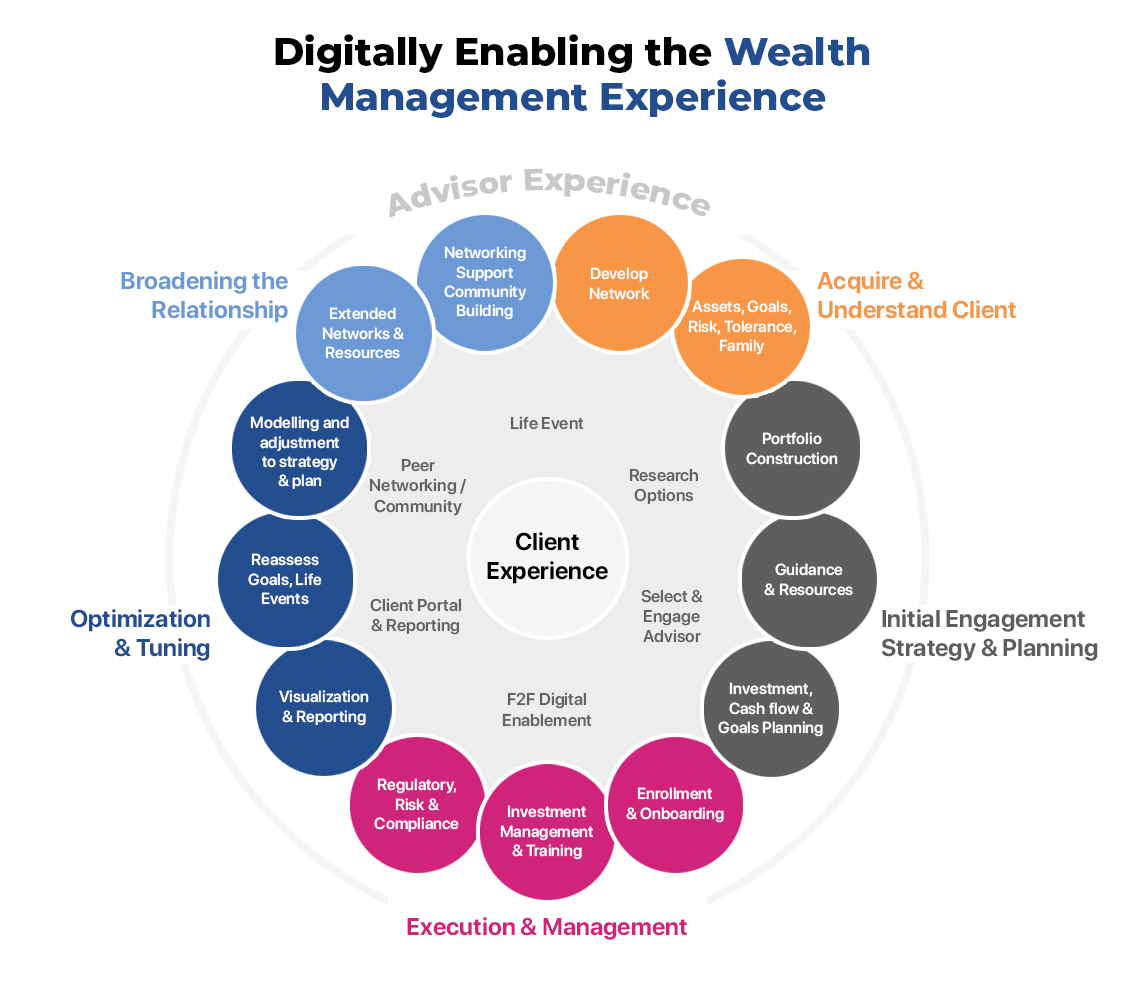
Financial Derivatives
10 Nov, 2019![]()


SAP ERP

Personality Grooming

Recruitment Process
10 Nov, 2019
view gallery
Data Visualization
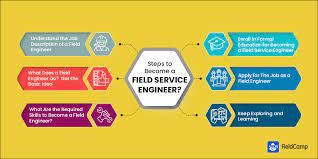
Service Engineer
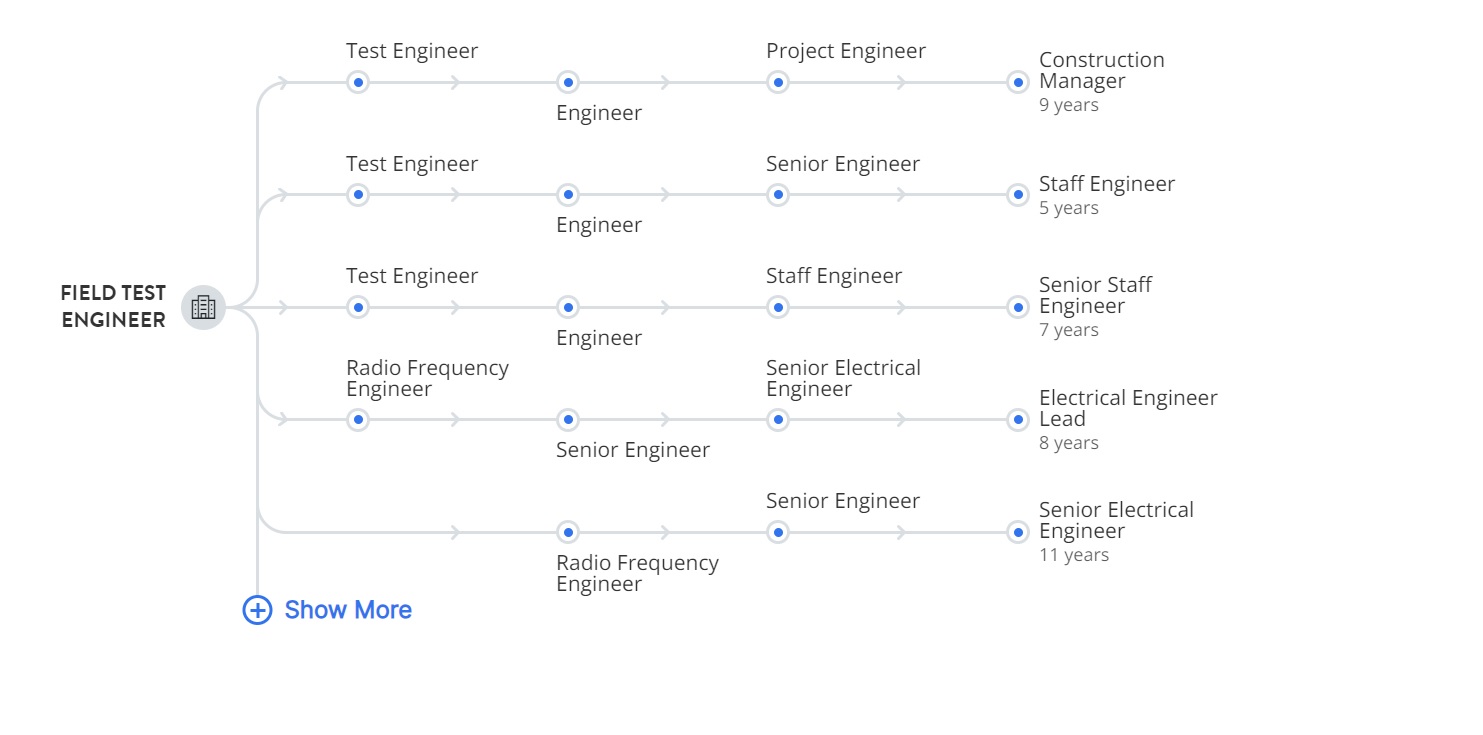
Field Test Engineer
10 Nov, 2019
view gallery
Technical Director
Software Developer

Programmer Analyst
10 Nov, 2019
view gallery